Words: Phillip Urbanik, Benocs
In theory, flow data should give us a nice, accurate view of what’s happening in our network. In reality, there’s a big elephant in the room: you never really know if the data you’re getting is complete. Flow exports are typically sent using UDP, and that means there are no guarantees. If a packet doesn’t make it to your collector – too bad, it’s gone.
For people who depend on flow data for analytics, capacity planning, security, and troubleshooting, that’s not just annoying – it’s dangerous. And most of the time, neither the user nor the collector has a way to detect if something’s missing.

Flow data (blue area chart) and SNMP counters (green line) should show a perfect match, indicating consistent traffic volumes reported by both monitoring methods.
Where the flow can fail
Most collectors can log packet loss, allowing us to identify and, consequently, do something the rectify the problem. And while the network in between could theoretically drop packets, in our experience, that’s rarely the bottleneck.
The real troublemaker? The exporter. That’s the router or switch generating the flows in the first place.
If the exporter silently drops flow data due to an internal issue, like a full buffer, nobody notices. Not the user. Not the collector. You just end up working with incomplete data, drawing the wrong conclusions, and maybe even alarming or scaling unnecessarily. The worst part? This often happens gradually as traffic grows, long after the initial configuration was done.

The exporter’s flow cache fills up and stops generating new flows. This is visible in the growing gap between SNMP and flow data during high traffic periods, while alignment remains during low-traffic hours.
The good news: it’s fixable
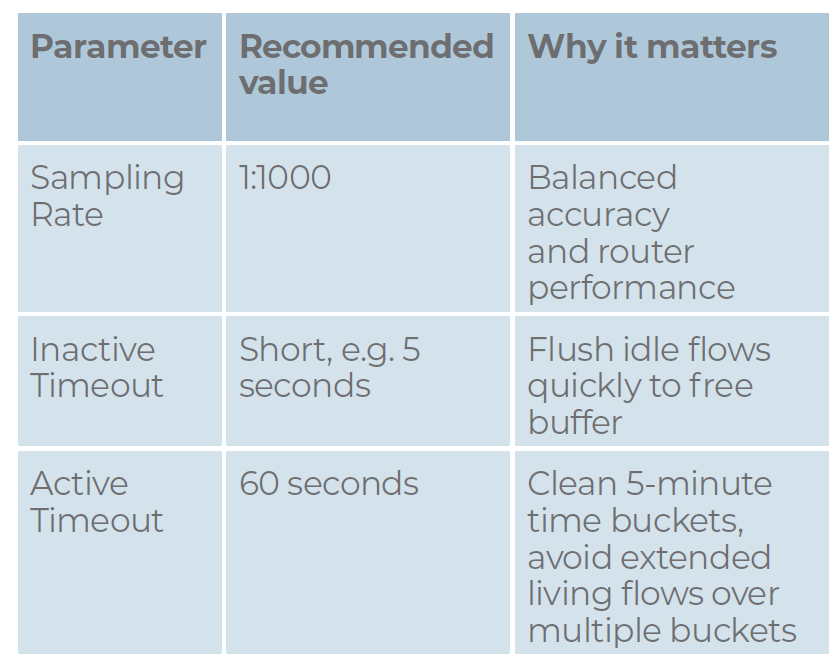
There are specific configuration parameters you can tweak to make flow exports more reliable and insightful. Here’s what matters most:
-
Sampling rate
This defines how many packets the router skips before recording one. A lower number means better accuracy.
- 1:1000 is a solid recommendation from us. It balances visibility into smaller flows with the router’s resource limits. With this, you can spot flows down to 1 Mbps or even less.
- A 1:1 sampling rate (every packet counted) would give you perfect insight, but would come with a cost: your router would need more memory. And guess what would happen if the buffer overflowed? Yep – data loss.
-
Inactive timeout
This defines how long the exporter waits without seeing new packets for a flow before it sends it out. We recommend 5 seconds. It keeps the buffers clean and prevents long-hanging flows from clogging up the memory.
-
Active timeout
This is the maximum duration a flow is kept “open” before being sent, even if new packets keep arriving.
If your analytics work in 5-minute buckets, this is crucial. If you use the vendor default (which is often too high!), flows will straddle multiple buckets and make your data messy. We recommend 60 seconds to ensure clean aggregation.
An high active timeout delays long-lived flows from being sent to the collector. This causes an underreporting of flow volume in the initial bucket and an overreporting in the next, leading to flow data exceeding the SNMP line.

Recommended config summary

Avoid redundant sampling
If you’re sampling on both ingress and egress interfaces, you’re doing double the work (and seeing double the data!). We recommend ingress-only. It’s the earliest point you can capture a flow, and it prevents duplication.
Ditch the default
Default configurations are not your friend. They are built for generic scenarios and not optimized for the accurate, actionable analytics we all depend on.
Take the time to check, tweak, and validate your exporter configuration. The benefits will ripple through the whole system: from better performance monitoring to more accurate security insights.
Visit us at TNC at booth #12 to find out how BENOCS Analytics can show you what is really flowing through your network.
You can also find further information at www.benocs.com.

Read the full online magazine here


